

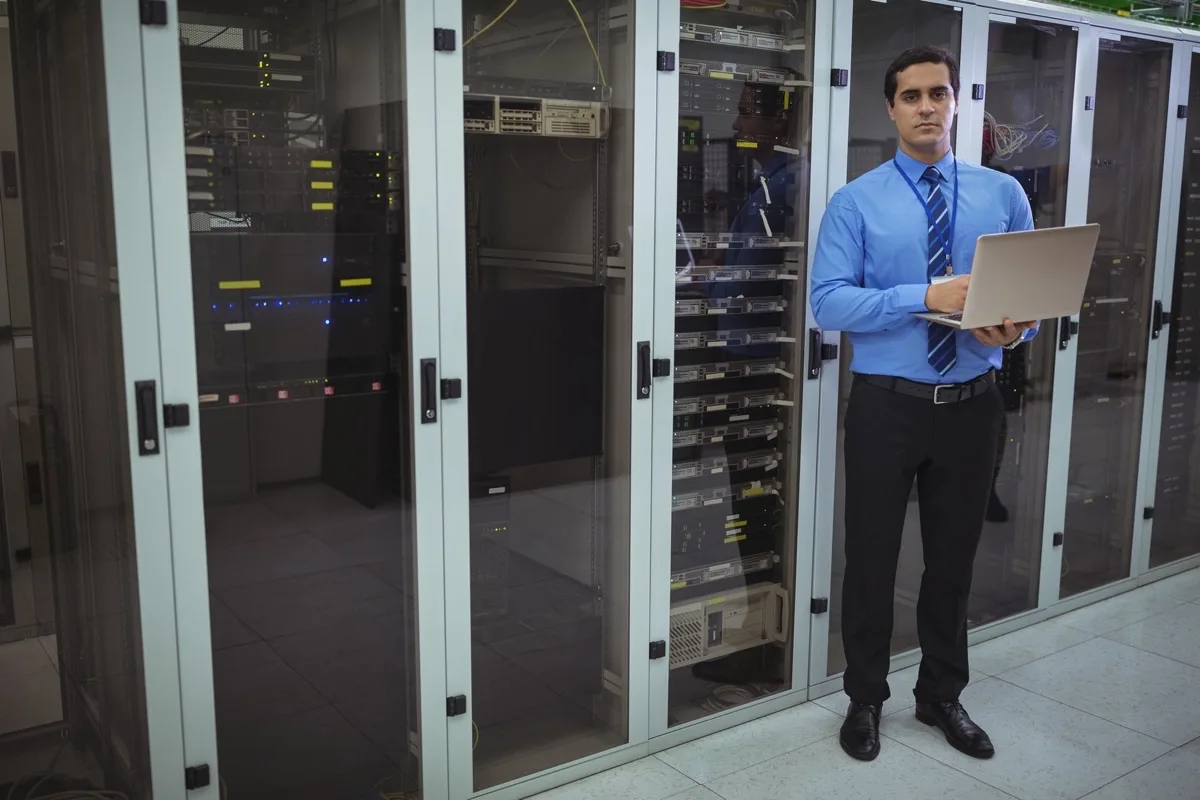
IT infrastructure monitoring from AbejaIT provides continuous visibility into server, application and network availability. We deploy alert systems, dashboards and SLA reports that help you respond before issues impact business operations.
Benefits
- 24/7 monitoring of servers, applications, databases and network devices
- SMS, email alerts and integrations with tools like PagerDuty or Slack
- Dashboards with performance, availability and resource utilisation metrics
- SLA reports and trend analysis supporting capacity planning
How we deliver
- Inventory — identifying infrastructure components requiring monitoring
- Tool configuration — deploying agents, probes and alerting rules
- Alert integration — notifications, escalations and incident response runbooks
- Continuous optimisation — threshold tuning, false positive reduction and scope expansion
FAQ
- Which monitoring systems do you use?
- We work with Zabbix, Prometheus, Grafana, Nagios and cloud tools including AWS CloudWatch and Azure Monitor.
- Does monitoring cover web applications?
- Yes, we monitor HTTP/HTTPS availability, response times, application errors and APM metrics.
- Will I receive monthly reports?
- Yes, we deliver availability, incident and optimisation recommendation reports per your SLA agreement.


